
Summary of Results:

All nine animals succeeded in all tests and, as a group, reached the learning criterion of 70% correct responses on session two in the object permanence and associative learning tasks; on session eleven in the quantity discrimination task; on session sixteen in the numerosity task with equally-sized dots; on session three in the numerosity task with various-sized dots; and averaged 84.4% correct responses in the long-term memory task.
Detailed Results:
Experiment 1 - Object permanence
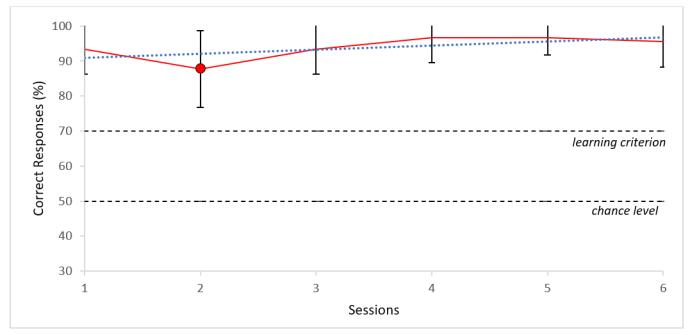
Regarding the animals’ performance as a group, the spider monkeys already performed above the learning criterion of 70% correct responses in the first two sessions and always remained there in all six sessions (Figure 6). Though the group’s performance did not increase significantly across the sessions (p=0.117, rs=0.706, two-tailed Spearman’s rho), the animals’ mean performance remained in the range of 90% to 100% correct responses.
Experiment 2 - Associative learning
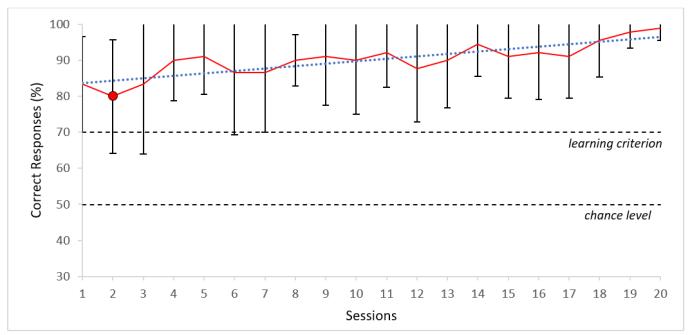
Regarding the animals’ performance as a group, their mean performance was already above the learning criterion of 70% correct responses in the first two sessions and always remained there in all 20 sessions (Figure 7). Nevertheless, the group’s performance increased significantly across the sessions (p<0.01, rs=0.836, two-tailed Spearman’s rho) as illustrated by the trendline showing a positive slope.
Experiment 3 - Quantity discrimination
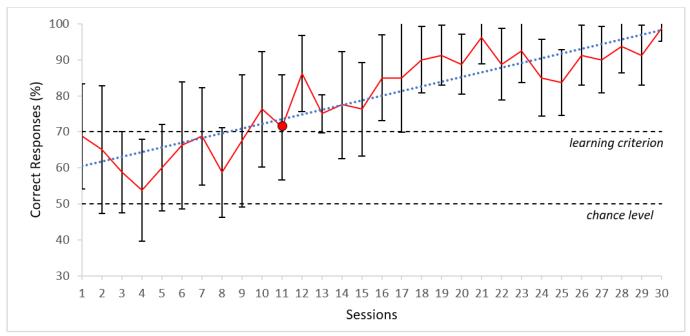
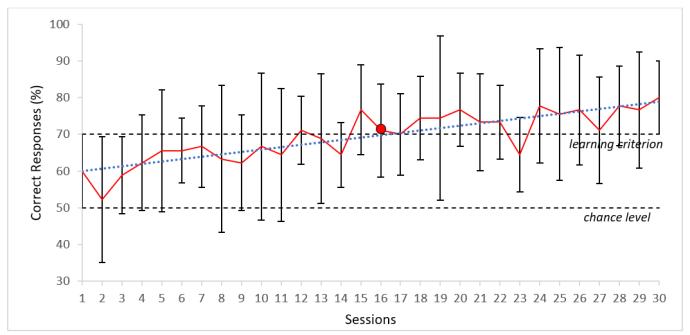
Regarding the animals’ performance as a group, the spider monkeys reached the learning criterion of 70% correct responses for the first time in session eleven and remained above the learning criterion in all following sessions (Figure 8). The group’s performance increased significantly across the sessions (p<0.01, rs=0.887, two-tailed Spearman’s rho) as illustrated by the trendline showing a positive slope.
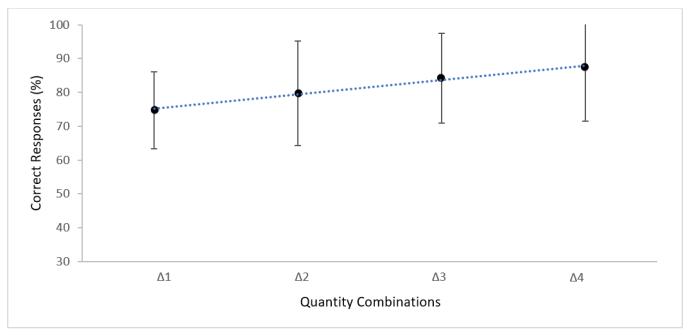
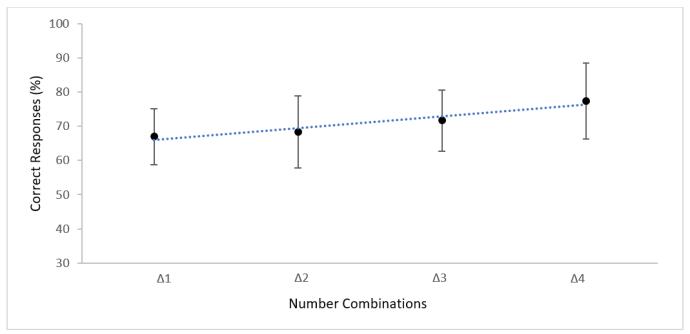
The monkeys’ performance as a group significantly correlated with task difficulty (p<0.01, rs=1, two-tailed Spearman’s rho) (Figure 9). Tasks in which the number of food items differed only by one (Δ1) yielded the lowest mean scores of correct responses and tasks in which the number of food items differed by four (Δ4) yielded the highest mean scores.
Experiment 4 - Numerosity with equally-sized dots
Regarding the animals’ performance as a group, the spider monkeys reached the learning criterion of 70% correct responses for the first time in session sixteen and only dropped under the learning criterion once – to 64.44% – in the following sessions (Figure 10). The group’s performance increased significantly across the sessions (p<0.01, rs=0.838, two-tailed Spearman’s rho) as illustrated by the trendline showing a positive slope.
The monkeys’ performance as a group significantly correlated with task difficulty (p<0.05, rs=1, two-tailed Spearman’s rho) (Figure 11). Tasks in which the number of dots differed only by one (Δ1) yielded the lowest mean scores of correct responses and tasks in which the number of dots differed by four (Δ4) yielded the highest mean scores.
Experiment 5 - Numerosity with various-sized dots
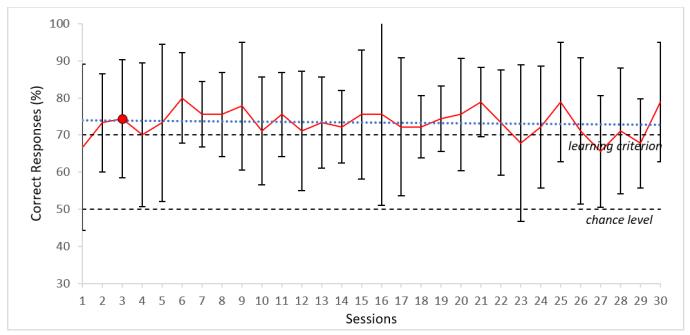
Regarding the animals’ performance as a group, the spider monkeys already reached the learning criterion in session three and displayed only occasional drops under the learning criterion – to 65.55% and to 67.77% – in the following sessions (Figure 12). It is interesting to note that while the group’s performance in the numerosity task with equally-sized dots gradually and significantly increased from around 60% to 80% across the sessions (Figure 15), the group’s performance in the numerosity task with various-sized dots already starts between 70% and 80%, and mostly remains in that range throughout the sessions (p=0.580, rs=-0.105, two-tailed Spearman’s rho) as illustrated by the trendline showing a relatively straight slope.
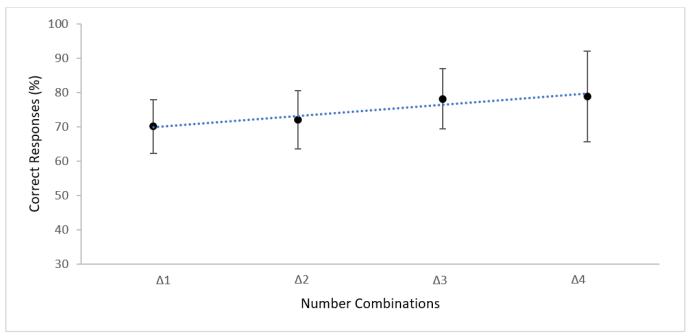
The monkeys’ performance as a group significantly correlated with task difficulty (p<0.05, rs=1, two-tailed Spearman’s rho) (Figure 13). Tasks in which the number of dots differed only by one (Δ1) yielded the lowest mean scores of correct responses and tasks in which the number of dots differed by four (Δ4) yielded the highest mean scores.
Experiment 6 - Long-term memory
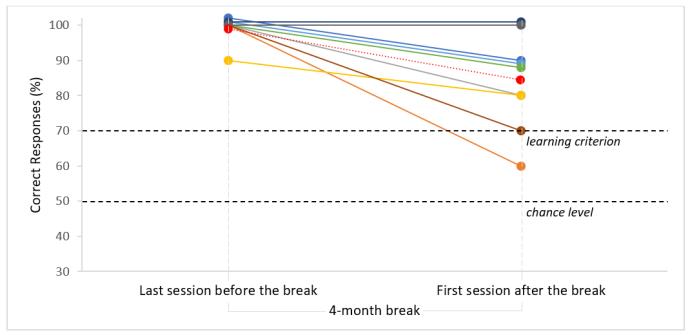
The animals’ performance in the long-term memory task – that is, their performance in the first associative learning session after a 4-month break – ranged between 60% for Gruñon and 100% for Mari and Lucas (Figure 14). Frida scored 70% correct responses, Neri and Cejitas scored 80% correct responses, and Soruyo and Margarita scored 90% correct responses. Accordingly, eight out of the nine animals scored at least 70% correct responses after the 4-month break and thus immediately reached the learning criterion. Regarding the animals’ performance as a group, their mean performance was 84.44%.
Responsible for this page:
Director of undergraduate studies Biology
Last updated:
06/01/20