
Trophic similarity
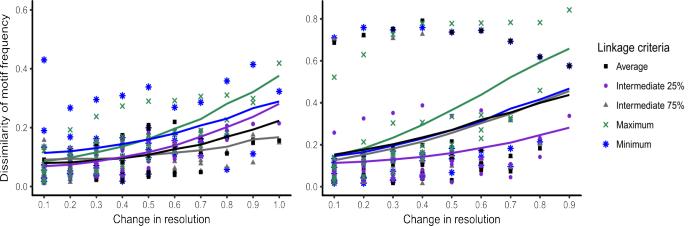
In the first analyses, the aggregations were based on trophic similarity. Dissimilarity in network structure increased as the difference in resolution increased. This is true for both complete and single methods of hierarchical clustering.
The correlation between dissimilarity in network structure and difference in resolution was significant for all five linkage methods for the complete clustering method and for the single clustering method.
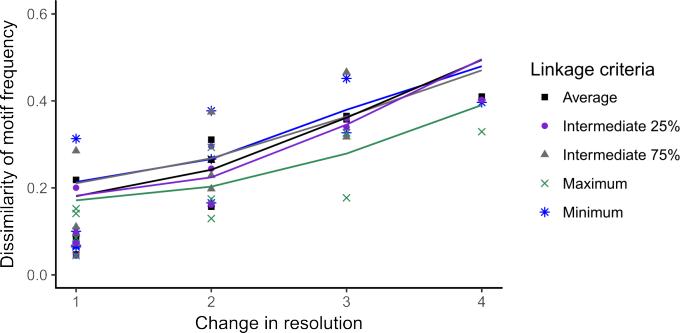
Taxonomic groups
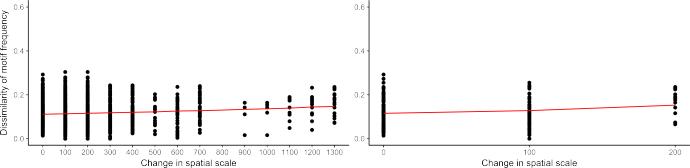
Spatial scale
In the third set of analyses, the aggregations were based on spatial distribution of subwebs. Dissimilarity in network structure did not increase as the difference in resolution increased
The correlation between dissimilarity in network structure and difference in resolution was not significant for any of the clustering methods, for the complete method and the single method.
Responsible for this page:
Director of undergraduate studies Biology
Last updated:
05/28/18