
Methods
Experimental setup
I used 76 red junglefowl chicks (males = 41, females = 35) hatched on 1st April, 2019 and raised at Linköping University (Sweden). These chicks come from a captive population which has been pedigree-bred since 2011 for research purposes.
Chicks were assigned to either a small or large social group on their first day of life until they were 5 weeks old. Chicks from the same pair of parents were carefully distributed between groups to control for genetic influences.
Each small group (replicates = 4) was composed of 7 chicks, whereas each large group (replicates = 3) was made up of 16 chicks. These sizes were chosen based on the ecological clutch size range reported for this species.
Once the chicks were five weeks old, they were moved to Vreta Gymnasiet, Linköping, where adult birds in our population are kept, and where retesting of females later took place.
Cognitive testing
The cognitive performance of 58 chicks (‘test’ birds, males = 28, females = 30) was assessed, while 18 remaining chicks were kept as additional birds to fill up large groups (‘non-test’ birds, males = 13, females = 5). Chicks were tested in isolation and in a random order during the day, which was not determined by their group nor group size. The food reward (ca. one third of a fresh mealworm) was the same throughout all training and testing.
Cognitive testing took place between 08:00-18:00 and it consisted of three tests presented in the following order:
- Inhibitory control. In this test, each chick had to obtain a reward from the centre of a transparent plastic cylinder (8 × 5 cm, L × Ø, see pictures below). Inhibitory control was measured as the number of trials, out of a total of five, in which a chick inhibited the impulse to peck at the reward through the cylinder and obtained it through the detour instead.
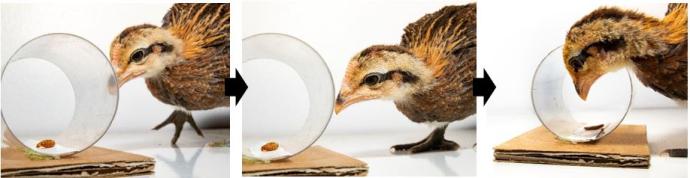
Chicks were first trained to retrieve the reward from an opaque cylinder of the same dimensions as the transparent one, so they could learn how to detour the cylinder in the test. A chick passed this training phase if it obtained the reward inside the cylinder in five consecutive trials, without pecking first at the cylinder. The procedure for testing was the same as for training, with the exceptions that the cylinder was now transparent.
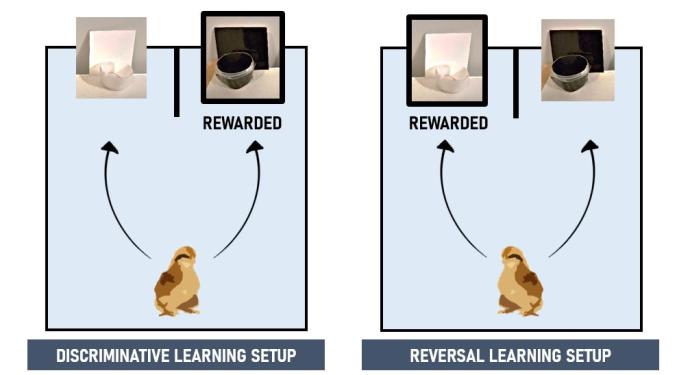
- Discriminative learning. In a colour discrimination test, a chick chose between two coloured bowls (3 × 5 cm, H × Ø), white (unrewarded) and black (rewarded), with two colour-matched laminated cards (9 × 9 cm) behind. The bowls were presented side by side separated by a cardboard barrier to encourage chicks to clearly choose between them (see picture below). A chick was considered to have learnt the discrimination if it made six correct choices in a row without help (the chance of randomly reaching this criterion is very low). The number of trials it took for a chick to reach this criterion was used as the measure of discriminative learning speed.
- Reversal learning. Chicks that passed the discriminative learning test (males = 28, females = 28) took part in a colour reversal learning test. The experimental protocol and learning criteria were as in the discriminative learning test, except that the black stimulus was now unrewarded, and the white stimulus rewarded (see picture below). Before testing, each chick was exposed to a “refresh” session of the discriminative learning test to ensure that the association between colour cue and reward in this test was still salient. Reversal learning speed was measured as the number of trials until reaching our learning criterion.
To assess individual variation in food motivation, the chick’s motivation to eat and work for food rewards was assayed after each cognitive testing session. To evaluate the influence of body condition on cognitive performance, I took morphometric measures (body condition and body fat score) of each chick.
After reaching sexual maturity, females (n = 31) were tested again in inhibitory control and discriminative learning tests. I was only able to retest females because the majority of males were unmotivated to work for food rewards (their focus was rather on the presence or calling of other conspecifics nearby!).
Group video recordings
To assess if group size affected how chicks behaved, each group was video recorded with 2 Sony HDR-AS50 Action cameras, 2-4 times a week, when all individuals were present in the pen. To reduce any disruptions in the normal behavioural routine of chicks, chicks from a pen about to be recorded did not experience any human disturbance from 15 min prior to the recording, and until the end of it. The time of the video recordings was always 11:00-13:00 and 14:00-17:00 to account for variation in daily activity levels observed in the groups. The recording order was semi randomized between groups to ensure that a group from each treatment was recorded during each time slot.
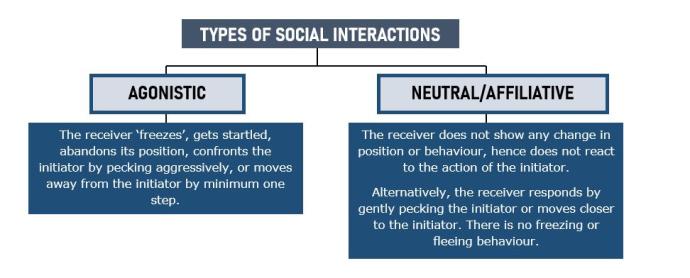
- Social interactions between individuals were recorded through continuous sampling of video recordings. Each interaction was classified as agonistic or neutral/affiliative depending on the response of the receiver to the interaction started by the initiator during the first 5 s of the interaction (diagram below). To further assess if more disturbances occurred during a specific behaviour (e.g. resting, foraging), I recorded the receiver’s behaviour prior to the interaction (resting, foraging, vigilance or self-care activities such as grooming). Foraging disturbances could also indicate the level of competition in a group, with more disturbances during foraging happening in those groups with more competition.
- Other behaviours that may have affected cognitive performance (i.e. resting, foraging, vigilance) were investigated by using group scans. These scans were carried out every 2 minutes from the moment the video recording started. The number of individuals performing each behaviour, out of the total, was recorded in each scan.
Statistical analyses

All statistical analyses were carried out in R version 3.6.2 (R Core Team, 2019).
I used general linear models (GLM) or mixed models (GLMM) for normally distributed data and generalized GLMs and GLMMs for non-normally distributed data.
If you want to know all the details about the statistical part of this project, please check out the link for the Master Thesis document in the section Downloads!
Responsible for this page:
Director of undergraduate studies Biology
Last updated:
05/16/20