
Results
Cognitive testing
Inhibitory control
Females had higher inhibitory control than males (females: 2.36 ± 0.30, males: 1.31 ± 0.32), and chicks in small groups had lower inhibitory control than those in large groups (small: 1.38 ± 0.28, large: 2.29 ± 0.33; Figure 1a). However, group size did not explain variation in test performance as much as sex (sex: ΣAICcω = 1; group size: ΣAICcω = 0.89).*
For inhibitory control in adult females, none of the top-ranking models explained variation better than the null model (ΔAICc < 2).*
Discriminative learning
Chicks in small groups learned faster than those in large groups (small: 7.68 ± 0.83, large: 16.00 ± 3.10; Figure 1b).*
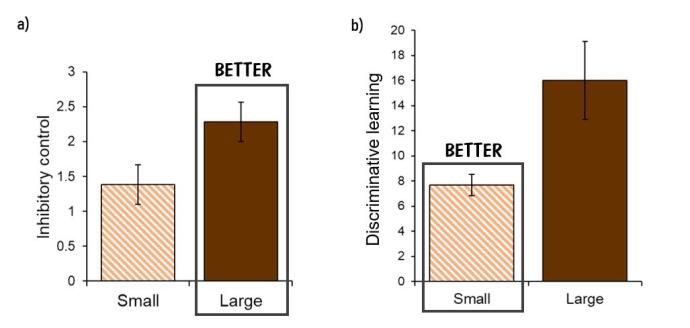
Figure 5. Effect of social group size on inhibitory control and discriminative learning in red junglefowl chicks. Comparison of test performance (a: inhibitory control, n = 54; b: discriminative learning, n = 57) between chicks living in small groups (striped bars), and those living in large groups (filled bars). Individuals in smaller groups had lower inhibitory control (a) and learnt faster (b) than those living in larger groups.* Mean and standard error (±) are given.
For adult females, none of the top-ranking models explained variation better than the null model (ΔAICc < 2).*
Reversal learning
None of the top-ranking models explained variation in reversal learning speed better than the null model (ΔAICc < 2).*
Group video recordings
Social interactions
For the total number of social interactions, as expected, there were more interactions in large groups than in small groups (small: 56.75 ± 3.59, large: 70.50 ± 5.14; Figure 2a).*
However, individuals from a small group had more interactions, on average, than those from a large group or pen (small: 9.62 ± 0.61, large: 7.08 ± 0.54, Figure 2b).*
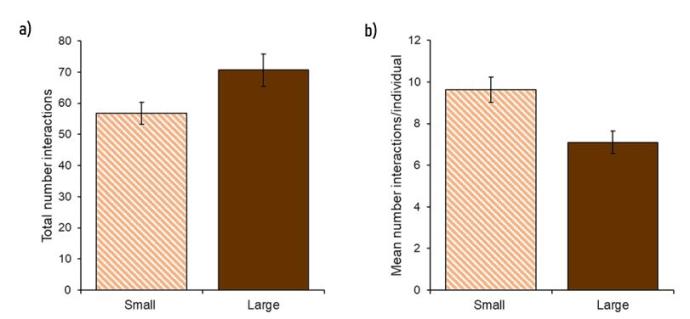
Figure 2. Effect of group size on number of social interactions in red junglefowl chicks during their first five weeks of life (n = 76). a) Differences in the total number of interactions per recording session between individuals living in small groups (striped bar) compared to those in large groups (filled bar). There were more interactions, overall, in the large groups than in the small groups.* b) Differences in the mean number of interactions, per individual, between small and large groups, in a recording session. On average, an individual from a small group performed more interactions than one from a large group.* Mean and standard error (±) are given.
More agonistic interactions were recorded than neutral and affiliative combined (agonistic: 38.88 ± 2.43, neutral and affiliative: 23.73 ± 1.46). Variation in each type of interaction was best explained by the receiver’s behaviour prior to the interaction, regardless of group size.*
Other behaviours
Group size did not explain variation in resting, foraging and vigilance as none of the top-ranking models explained variation in these behaviours better than the null model (ΔAICc < 2, Figure 3).*
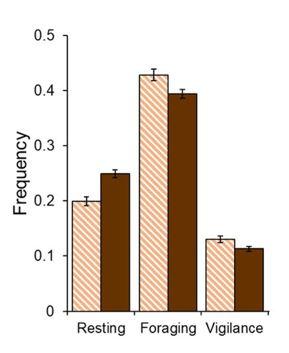
Figure 3. Effect of group size on behaviours observed in groups of red junglefowl chicks (n = 76). Differences in the frequency (i.e. number of chicks performing a behaviour relative to the total number of chicks visible) of resting, foraging and vigilance between chicks living in small groups (striped bars) and large groups (filled bars), during their first five weeks of life. Group size did not explain differences in behavioural frequencies better than null models for any of the behaviours (ΔAICc < 2).* Mean and standard error (±) are given.
* Please check the Master Thesis document in the section Downloads for full details on the results.
Responsible for this page:
Director of undergraduate studies Biology
Last updated:
05/16/20